System Health Check using Server Sent Events API


We usually come across requirements to continuously monitor system health checks for our web applications. Generally people choose server side sockets to continuously send the data without client request. There is a better way to continuously pass server data using the server sent events HTML SSE API. Web socket will be full duplex communication, where both client and server need to be connected. In the Server Side Event api, the client just invokes the api and server keeps sending the health data continuously.
What are Server-Sent Events?
Server-Sent Events (SSE) is a server push technology enabling a client to receive automatic updates from a server via an HTTP connection, and describes how servers can initiate data transmission towards clients once an initial client connection has been established.
They are commonly used to send message updates or continuous data streams to a browser client and designed to enhance native, cross-browser streaming through a JavaScript API called EventSource, through which a client requests a particular URL in order to receive an event stream. The EventSource API is standardized as part of HTML5. The MIME type for SSE is text/event-stream.
Developing a web application that uses server-sent events is straightforward. This is a one-way connection, so one can't send events from a client to a server.
Server Sent Events (SSE) (Also known as EventSource) are a great way to send data instantly to the browser.The browser then listens for any messages you want to relay to the browser, whether that be a visual notification to the user or just an update to existing content.
How to send data through SSE API?
We need to set the headers correctly for the client to recognize the SSE API. In PHP, it is done by setting the header at the start of the stream.
header("Content-Type: text/event-stream");
header("Cache-Control: no-cache");
First, it sets the MIME type to text/event-stream, which is required by the server-side event standard. The second line tells the web server to turn off caching otherwise the output of the script may be cached.
We are going to send messages through HTML5 server-sent events which must start with the text data: followed by the cpu load statistics.
echo "data: CPULoad: {$cpuload}-\n";And finally, we have used the PHP flush() function to make sure that the data is sent right away, rather than buffered until the PHP code is complete.
flush();
How to Receive events from the server?
The server-sent event API is contained in the EventSource interface. To open a connection to the server to begin receiving events from it, create a new EventSource object with the URL of a script that generates the events. For example:
var source = new EventSource("server_time.php");Once you've instantiated your event source, you can begin listening for messages from the server by attaching a handler for the message event object.
source.onmessage = function(event) {
     let text = event.data;
    document.getElementById("result").innerHTML += text ;
}
Above code receives the incoming messages (that is, notices from the server that do not have an event field on them) and appends the message text to a div container of the web page.
This code is similar, except that it will be called automatically whenever the server sends a message with the event field set to "ping". A string identifying the type of event described. If this is specified, an event will be dispatched on the browser to the listener for the specified event name.
Below are other events available for listening on the opening of the event and error happens listener.
source.addEventListener("open", listener);
source.addEventListener("error", listener);
We can also send custom events from the server by sending event name and event data.
echo "event: ping\n";
$curDate = date(DATE_ISO8601);
echo 'data: {"time": "' . $curDate . '"}';
In client side, we can write the listeners to it by having addEventListener():
source.addEventListener("ping", (event) => {
    //code goes here….
});
Let’s go through an example of displaying system’s cpu load and memory details I.e( Total memory,memory used,Remaining memory) using the server sent events lively.
System health check using server sent events:
First, create a file called server_time.php which is going to create an SSE API. Let’s use the WMIC windows native method to get the system statistics. Cpu usage and memory usage are the key API to take from the WMIC command to show the percentage of usage in the UI. The data will be send through echo with data prefix.
<?php
header("Content-Type: text/event-stream");
header("Cache-Control: no-cache");
$wmi = new COM('WinMgmts:\\\\.');
//$wmi = new COM('WinMgmts:\\\\.');
$cpus = $wmi->InstancesOf('Win32_Processor');
$cpuload = 0;
$cpu_count = 0;
foreach ($cpus as $key => $cpu) {
$cpuload += $cpu->LoadPercentage;
$cpu_count++;
}
$res = $wmi->ExecQuery('SELECT FreePhysicalMemory,FreeVirtualMemory,TotalSwapSpaceSize,TotalVirtualMemorySize,TotalVisibleMemorySize FROM Win32_OperatingSystem');
$mem = $res->ItemIndex(0);
$memtotal = round($mem->TotalVisibleMemorySize / 1000000,2);
$memavailable = round($mem->FreePhysicalMemory / 1000000,2);
$memused = round($memtotal-$memavailable,2);
// WIN CONNECTIONS
$connections = shell_exec('netstat -nt | findstr :80 | findstr ESTABLISHED | find /C /V ""');
$totalconnections = shell_exec('netstat -nt | findstr :80 | find /C /V ""');
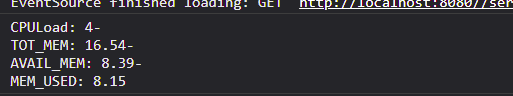
echo "data: CPULoad: {$cpuload}-\n";
echo "data: TOT_MEM: {$memtotal}-\n";
echo "data: AVAIL_MEM: {$memavailable}-\n";
echo "data: MEM_USED: {$memused}\n\n";
flush();
?>
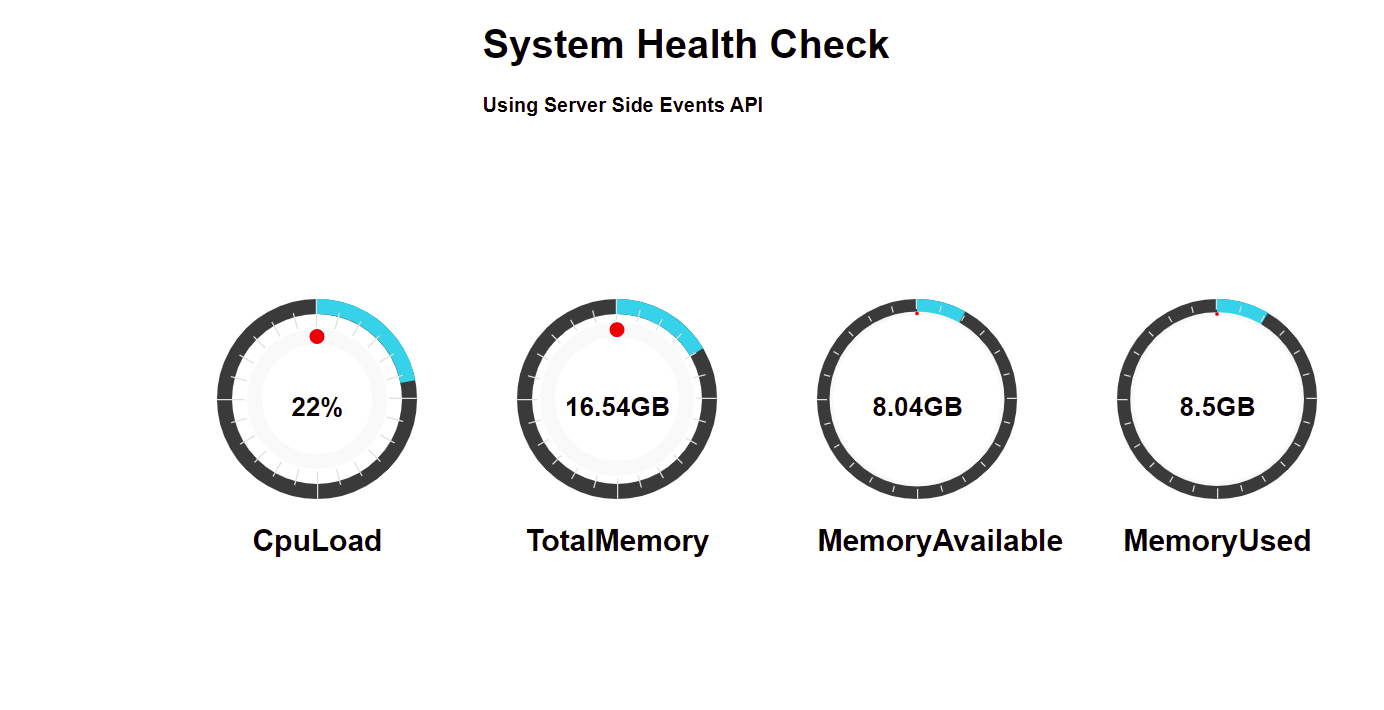
On the client side we will need to establish the stream, have the polyfill and then create a stream using the code below in your javascript file. Instead of showing the data, we are going to use EasyPieChart javascript api, to show statistics data that looks visually appealing.
Also we need to write data transformation functions to get the server data split by key and value and then based on the key, that respective pie chart will be updated.
Four charts for cpu usage, total cpu, memory used, total memory, in which usage will keep changing based on the server activities. Values are set through the onStep event handler of easy pie charts from the server values.
<script>
    if (typeof (EventSource) !== "undefined") {
        var source = new EventSource("server_time.php");
        source.onmessage = function (event) {
            let text = event.data;
            const myArray = text.split("-");
            for (var i = 0; i < myArray.length; i++) {
                var nObjKey = myArray[i].split(":")[0].trim();
                if (nObjKey === "CPULoad") {
                    var element = document.querySelector('#cpuLoad');
                    var cpuLoadVal = myArray[i].split(":")[1].trim();
                    $("#cpuLoad").data('easyPieChart').update(cpuLoadVal);
                    var chart = new EasyPieChart(element, {
                        size: 160,
                        lineWidth: 12,
                        scaleColor: '#dfe0e0',
                        scaleLength: (parseFloat(cpuLoadVal)),
                        onStep: function (from, to, currentValue) {
                            this.el.querySelector('.number').innerText = (parseFloat(cpuLoadVal)) + '%';
                        },
                    });
                }
                else if (nObjKey === "TOT_MEM") {
                      var element = document.querySelector('#totalmem');
                      var totalMemVal=myArray[i].split(":")[1].trim();
                      console.log("TOT_MEM",totalMemVal);
                     $("#totalmem").data('easyPieChart').update(totalMemVal);
                     var chart = new EasyPieChart(element, {
                         size: 160,
                         lineWidth: 12,
                         scaleLength: (parseFloat(totalMemVal)),
                        onStep: function(from, to, currentValue) {
                             //console.log( this.el)
                           this.el.querySelector('.number').innerText = (parseFloat(totalMemVal))+'GB';
                       },
                }
                else if (nObjKey === "AVAIL_MEM") {

                       // console.log("AVAIL_MEM",availmemValue);
                      var element = document.querySelector('#memavail');
                      var availmemValue=myArray[i].split(":")[1].trim();
                     $("#memavail").data('easyPieChart').update(availmemValue);
                    var chart = new EasyPieChart(element, {
                            size: 160,
                            scaleLength: (parseFloat(availmemValue)),
                           onStep: function(from, to, currentValue) {
                                // console.log( this.el)
                              this.el.querySelector('.number').innerText = (parseFloat(availmemValue))+'GB';
                }
                else if (nObjKey === "MEM_USED") {
                 {
                         console.log("MEM_USED",memUsedValue);
                          var element = document.querySelector('#memused');
                          var memUsedValue=myArray[i].split(":")[1].trim();
                         $("#memused").data('easyPieChart').update(memUsedValue);
                         var chart = new EasyPieChart(element, {
                               size: 160,
                              scaleLength: (parseFloat(memUsedValue)),
                             onStep: function(from, to, currentValue) {
                                  // console.log( this.el)
                                  this.el.querySelector('.number').innerText = (parseFloat(memUsedValue))+'GB';
                            },
                       });
                }
                else {
                    console.log("hello else");
                    document.getElementById("result").innerHTML = "Sorry, your browser does not support server-sent events...";
                }
                $(document).ready(function () {
                    $(function () {
                        $('.chart').easyPieChart({
                            size: 160,
                            barColor: "#17d3e6",
                            scaleLength: 0,
                            lineWidth: 12,
                            trackColor: "#373737",
                            lineCap: "circle",
                            animate: 2000,
                        });
                    });
                });
            }
        }
    }
</script>
Once start the server, in the web console, data from server side as event.data are logged in the console.
In the UI, finally it shows up the server health data as pie chart
Complete source code and setup instructions can be referred in the public github repository.